One of the first questions investors ask is a simple one: how much will the plant produce? The answer is never a single number from a catalogue. The same panel capacity on two different roofs can deliver noticeably different annual output — because of location, orientation, shading, temperature and how the system is designed. This article explains what drives yield and how to read the estimate you get from an installer.
kWp is not kWh
First, the difference between two units that are constantly confused:
- kWp (kilowatt-peak) is the rated power of the panels measured under standard test conditions (STC: irradiance of 1,000 W/m², cell temperature of 25 °C). It is the “size” of the plant.
- kWh (kilowatt-hour) is the energy the plant actually produces over time. It is what shows up on your bill.
A 100 kWp plant rarely runs at a full 100 kW: in the morning, in the evening, in winter and in cloudy weather irradiance is well below 1,000 W/m², and in summer panels run hotter than 25 °C. That is why output is expressed as specific yield — kWh per kWp per year (kWh/kWp). This figure lets you compare plants of different sizes and locations.
Annual output = installed capacity (kWp) × specific yield (kWh/kWp). Everything that follows affects the second term of that equation.
1. Solar irradiation: location within BiH
The basic input is the amount of solar energy that reaches the site each year (global horizontal irradiation, expressed in kWh/m²). Bosnia and Herzegovina has good solar potential by European standards, but the differences within the country are not negligible:
- Herzegovina and the south have more sunshine hours and stronger irradiation, influenced by the Mediterranean climate.
- The north and north-west (Posavina, Krajina, the Tuzla area) have somewhat lower irradiation, more overcast days and more frequent fog in the colder months.
- Basins and valleys in central Bosnia can experience winter fog and temperature inversions, reducing output in months when it is already at its lowest.
- Surrounding terrain — mountains and hills can shorten the day at a site, especially in winter when the sun is low.
For an indicative figure for your location, we recommend the free PVGIS tool from the European Commission’s Joint Research Centre, or the World Bank’s Global Solar Atlas. In PVGIS you pick a point on the map, enter capacity, tilt and orientation, and get an estimate of monthly and annual output. It is a good starting point, but it does not replace a simulation of your specific building.
2. Orientation and tilt
In the northern hemisphere, the highest annual output per kWp comes from a plant facing due south, at a tilt usually somewhat lower than the site’s latitude (PVGIS calculates the optimum tilt automatically). Departing from that has a cost, but also some benefits:
| Configuration | Output per kWp | When it makes sense |
|---|
| South, optimal tilt | Highest | Ground-mounted plants, south-facing pitched roofs |
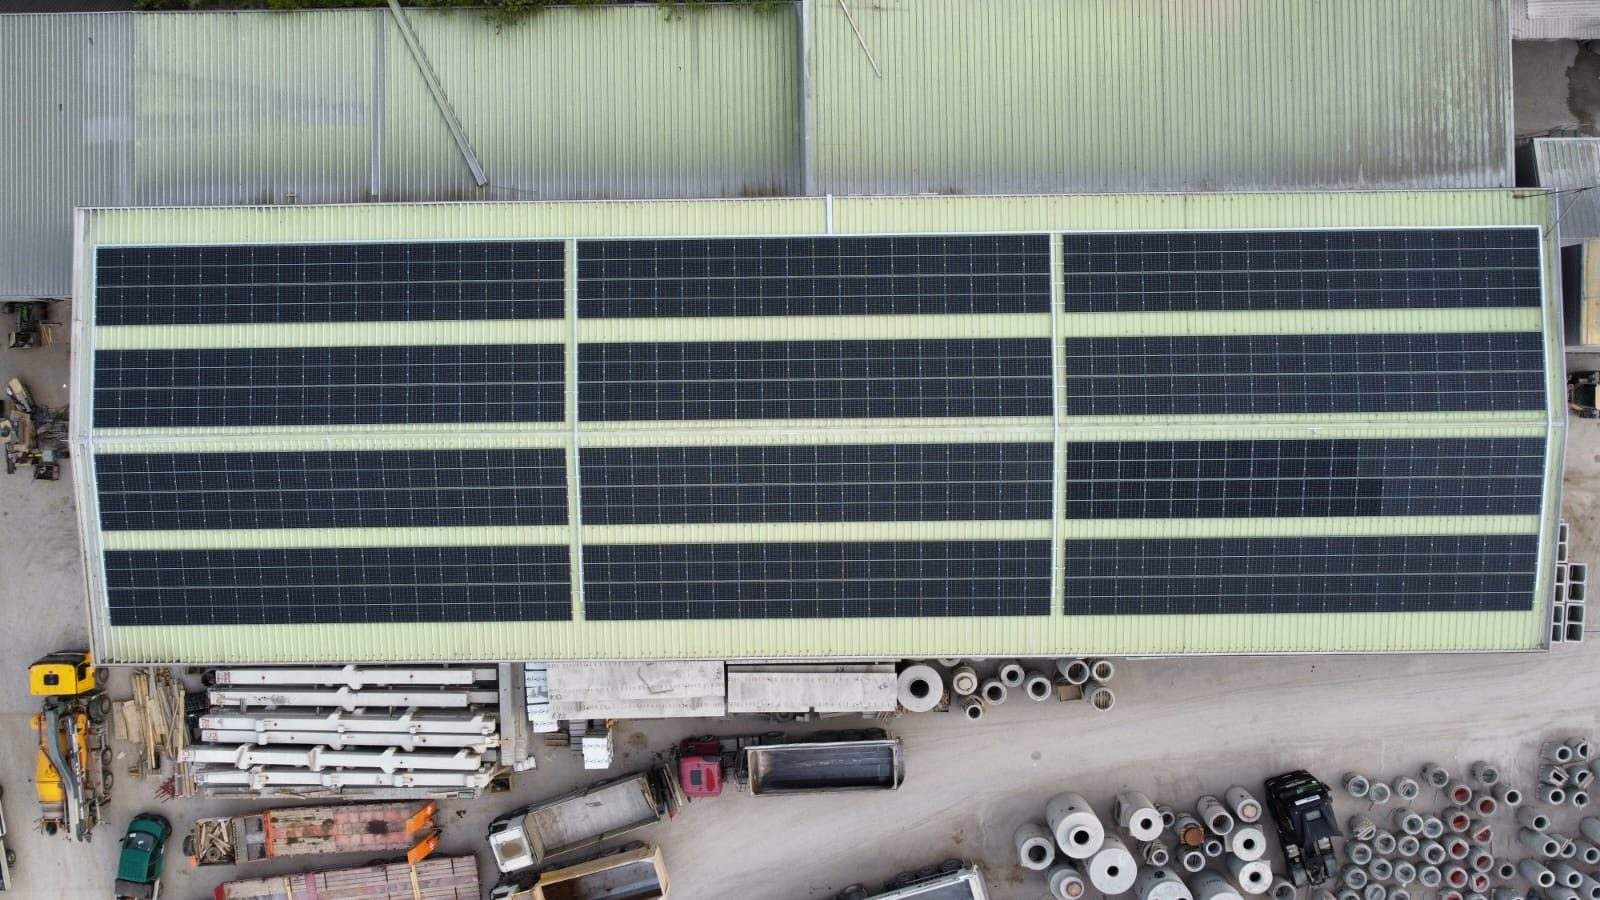
| East-west, low tilt | Lower than south | Flat roofs — more capacity on the same area, flatter daily output curve |
| South-east / south-west | Slightly lower than south | Pitched roofs not facing due south |
| Panels flush with the roof (low tilt) | Lower; more soiling | Lightweight roofs with limited load capacity |
The takeaway is not that south is always better. For businesses the goal is to consume as much output on site as possible, so an east-west plant that produces in the morning and afternoon often tracks working hours better than an “ideal” south-facing one. More on this in our guide to commercial solar.
3. Shading
Shading is the most underestimated loss. Panels in a string are connected in series, so shade on part of one panel can reduce the output of the whole string, not just that panel. Typical sources:
- chimneys, vents, air-conditioning units and parapets on the roof,
- neighbouring buildings, trees (which grow) and poles,
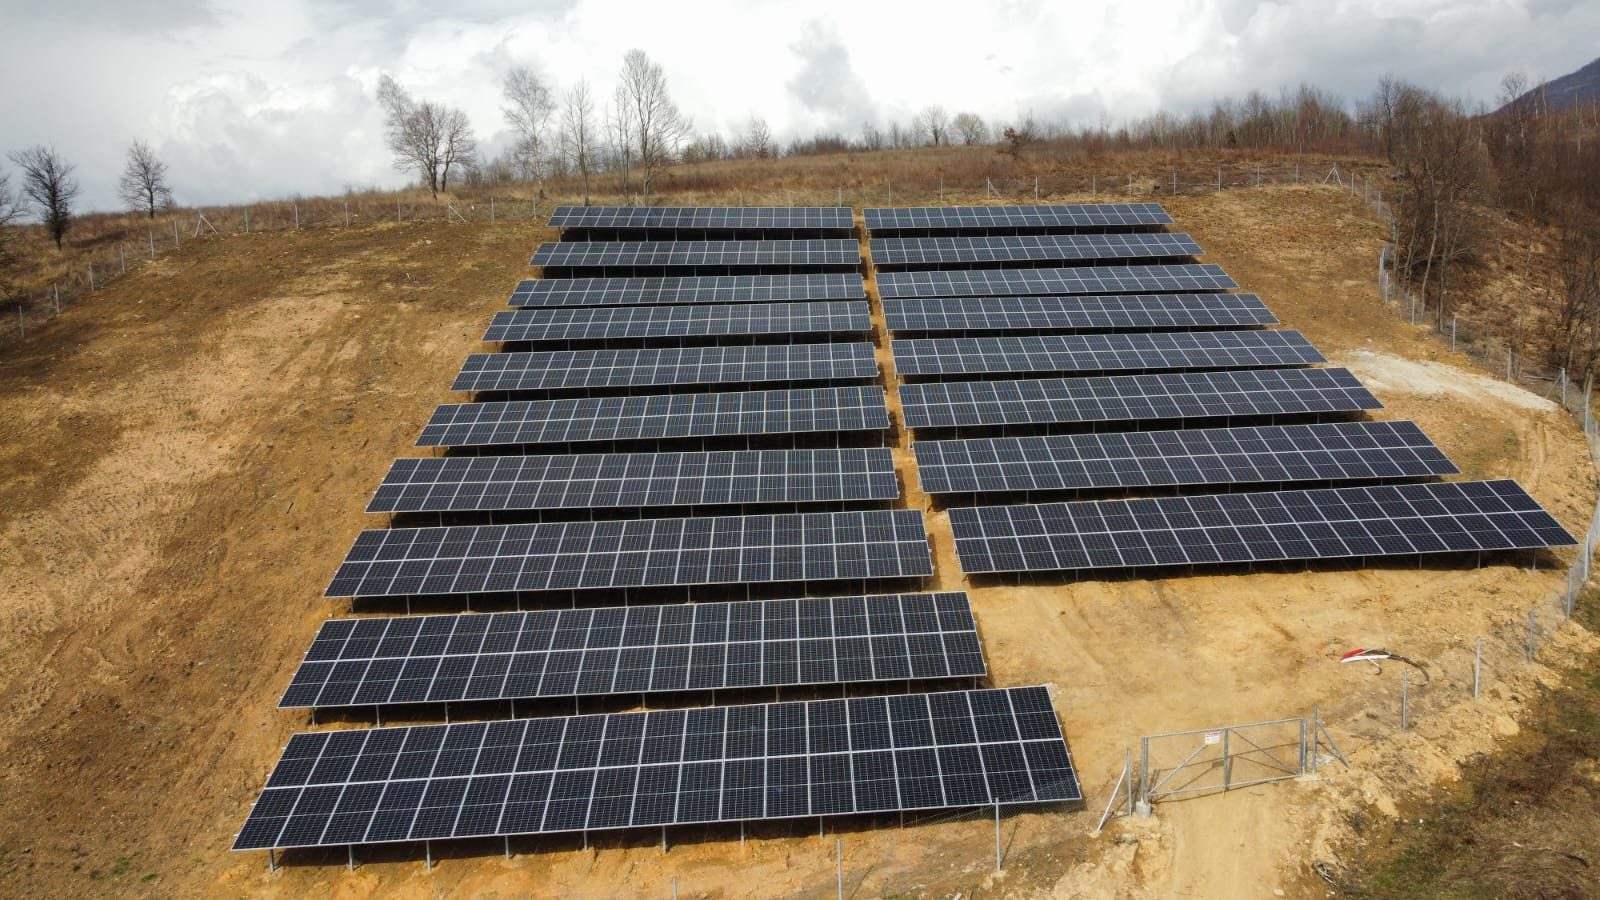
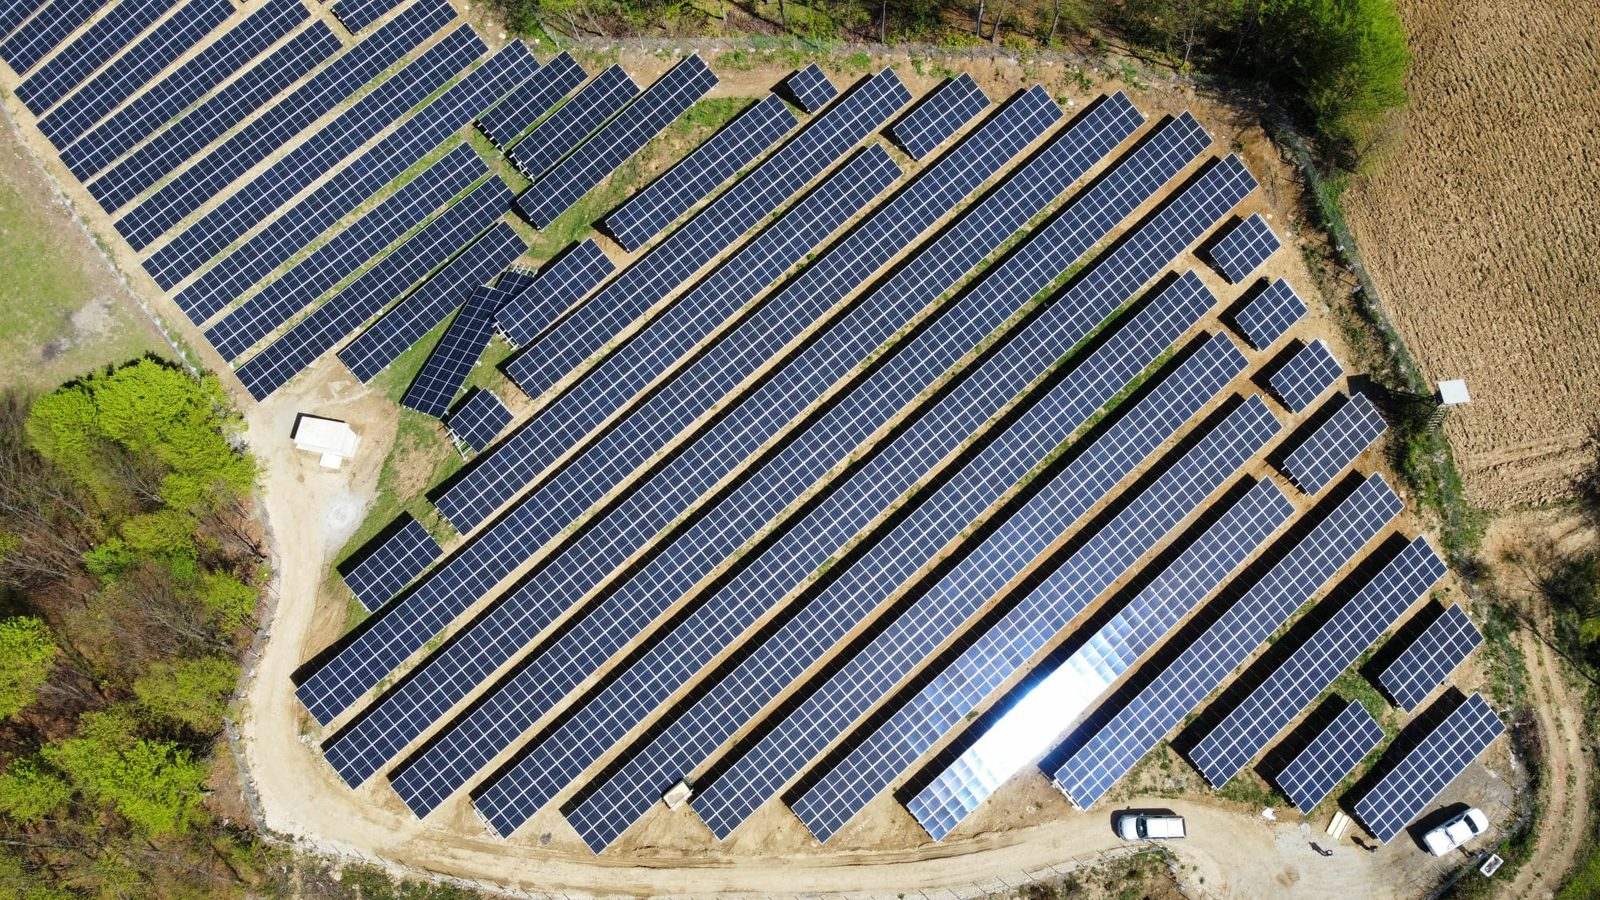
- inter-row shading — on ground-mounted plants and flat roofs, row spacing is set so that rows do not shade one another when the sun is low.
Shading is managed through panel layout, careful string design and, where it makes sense, power optimisers. A good yield estimate always includes a shading analysis of the specific site.
4. Temperature
Panels work more efficiently when they are cool. For crystalline silicon panels, power falls as cell temperature rises — the exact temperature coefficient is in the panel datasheet (usually given as a negative percentage per °C). On a hot summer day the cell can be considerably warmer than the air, so instantaneous power is below the rated value.
That is why good ventilation behind the panels matters: panels mounted on a frame with a gap to the roof stay cooler than panels laid directly on the roof covering. Paradoxically, a sunny, cold spring day can deliver higher instantaneous power than the hottest day in July.
5. Inverter sizing and clipping
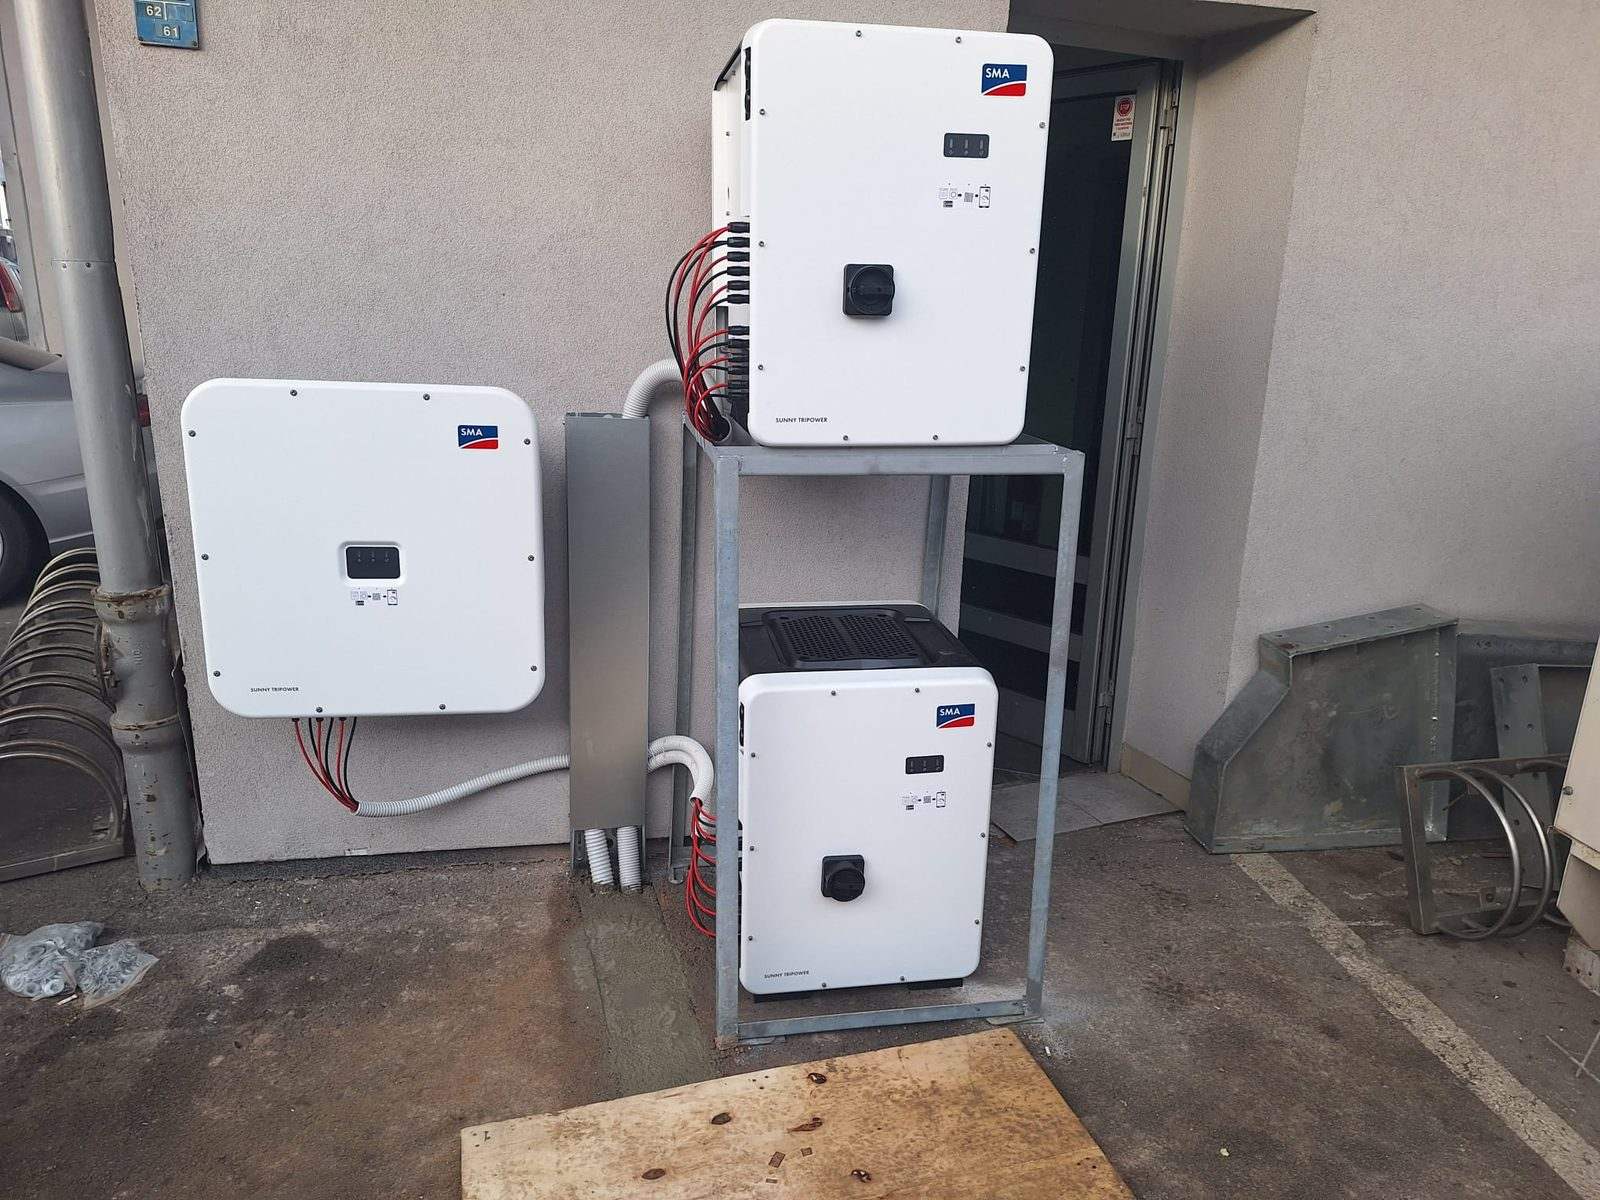
The inverter converts direct current from the panels into alternating current. It is common practice for panel capacity (DC) to be somewhat higher than inverter capacity (AC), because panels rarely deliver full rated power. With a well-chosen DC/AC ratio, the inverter operates closer to its optimal load for more of the day.
If the ratio is too high, during the sunniest hours the inverter “clips” power above its rated output. A little clipping is normal and economically justified; a lot of clipping is wasted energy. Output is also affected by inverter efficiency, cable and transformer losses, and any export limits imposed on grid feed-in.
6. Soiling and snow
Dust, pollen, bird droppings and soot reduce the amount of light reaching the cells. Rain washes some of it away, especially on more steeply tilted panels. On low-tilt panels, near roads, in industrial zones and close to farmland, soiling is more pronounced and cleaning can be worthwhile.
In winter, snow can cover panels completely and stop production until it slides off or melts. A steeper tilt helps. Snow losses mostly fall in months when output is already at its lowest, but they should be considered at higher and colder sites. For more on cleaning and inspections, read our article on solar plant maintenance.
7. Degradation
Panels slowly lose power over the years. The drop is usually somewhat larger in the first year, then continues more slowly and roughly linearly. Manufacturers provide a power output warranty over 25 or 30 years — check the exact figures in the datasheet and warranty terms. A payback calculation should account for lower output in later years rather than simply multiplying first-year output by 25.
How to read a yield estimate
When you receive a proposal, the yield estimate should clearly show:
- the source of irradiation data (e.g. PVGIS or another meteorological dataset),
- the assumed orientation, tilt and layout of the panels,
- a shading analysis for the specific building,
- individual losses — temperature, soiling, cabling, inverter, module mismatch,
- specific yield (kWh/kWp) and total annual output,
- monthly distribution — how much in summer and how much in winter,
- the assumption on degradation over the years.
If an estimate gives only one number with no assumptions, ask for an explanation. Be careful with PVGIS too: by default it assumes total system losses of 14%, which is a reasonable starting assumption, but it does not account for shade from a chimney or the building next door.
Bear in mind year-to-year variability as well: a sunnier and a cloudier year can differ by several per cent. An estimate represents an average year.
The performance ratio is the ratio of actual output to the theoretical output the plant would deliver with no losses at the irradiation measured on site. Because irradiation is taken out of the equation, PR shows the quality of the plant itself: how much is lost to temperature, cabling, the inverter, soiling and faults. Indicatively, well-designed and maintained plants have a PR in the range of around 75 to 85%, but the value depends on climate, measurement method and the period observed. The measurement methodology is defined in the IEC 61724-1 standard.
Specific yield and PR answer different questions:
- kWh/kWp — how much energy I get for each kWp (depends on location and design),
- PR — how well the plant performs given the sun it had.
Monitoring: how to know the plant is producing what it should
A yield estimate is only useful if it is later compared with reality. The monitoring system (usually the inverter manufacturer’s portal) shows output by day, string and inverter. What to watch for:
- comparing identical inverters or strings — if one produces noticeably less than the others under the same conditions, something is wrong,
- monthly comparison with the estimate — bearing in mind that the month may have been sunnier or cloudier than average,
- alarms — an inverter or string failure can go unnoticed for weeks if nobody is watching,
- on larger plants, an on-site irradiance sensor allows a proper PR calculation.
Conclusion
A solar plant’s annual output is not a property of the panels but of the whole system at a specific site. Location within BiH determines how much sun is available; design — orientation, layout, inverter choice and avoiding shade — determines how much of it becomes kWh. Monitoring and maintenance protect that result over the years.
Since 2011 we have completed 71 projects totalling around 30,000 kWp — rooftop and ground-mounted plants for industry, banks and households. For a realistic yield estimate for your building, request a quote or get in touch. See also our solar plant design and construction and energy consulting services.
Sources